Platform Analytics
The Analytics dashboard provides insights into how users interact with your 3D models and configurators.
It helps track engagement, user behavior, product interactions, and conversion signals.
Analytics allows teams to understand how customers explore products and optimize the interactive experience.
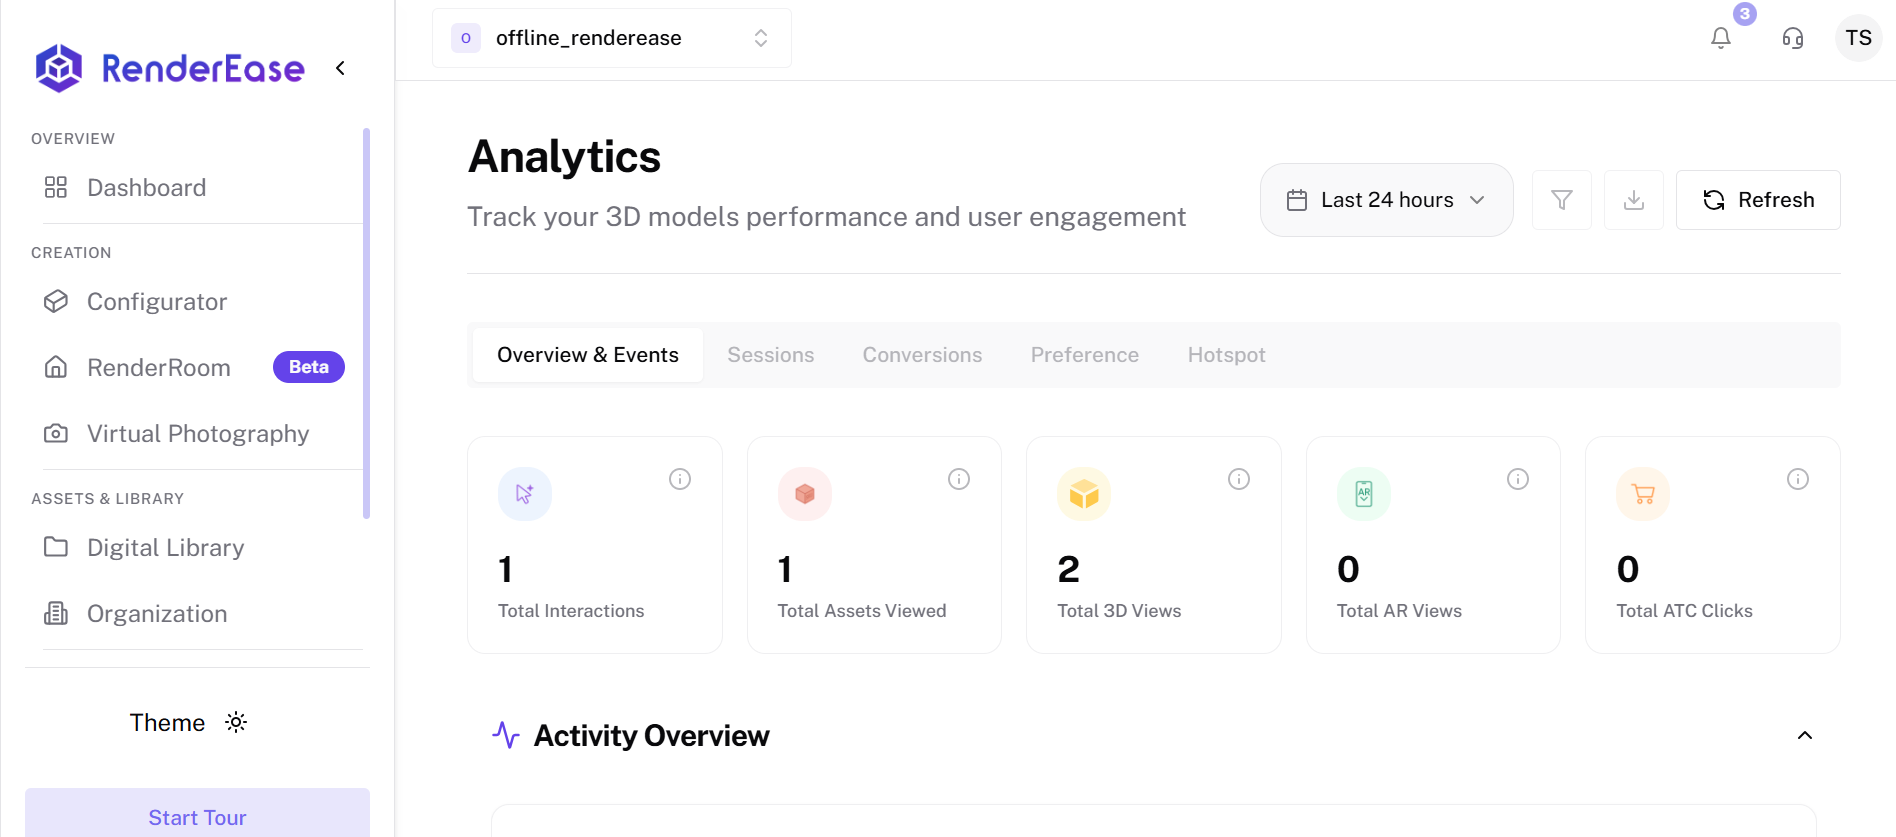
Overview & Events
The Overview & Events section provides high-level metrics for the selected time range.
Key metrics include:
- Total Interactions – Number of user interactions with the 3D viewer.
- Total Assets Viewed – Number of times different 3D assets were opened.
- Total 3D Views – Total number of times the 3D viewer was loaded.
- Total AR Views – Number of Augmented Reality sessions launched.
- Total ATC Clicks – Number of Add To Cart clicks triggered from the viewer.
These metrics help measure overall engagement with your interactive products.
Total Interactions
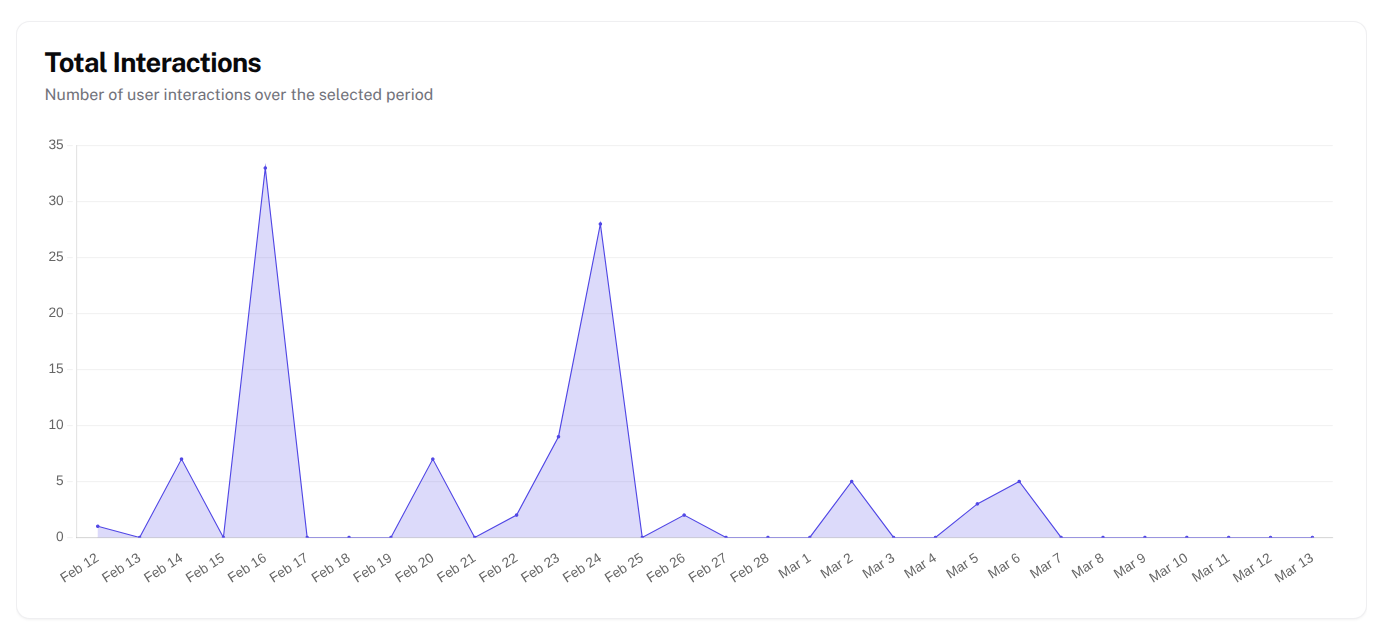
The Total Interactions graph shows how users interact with the 3D model over time.
It tracks:
- clicks
- viewer interactions
- product exploration activity
The chart displays interaction counts across the selected time period, helping identify peak engagement times.
Growth & Trends
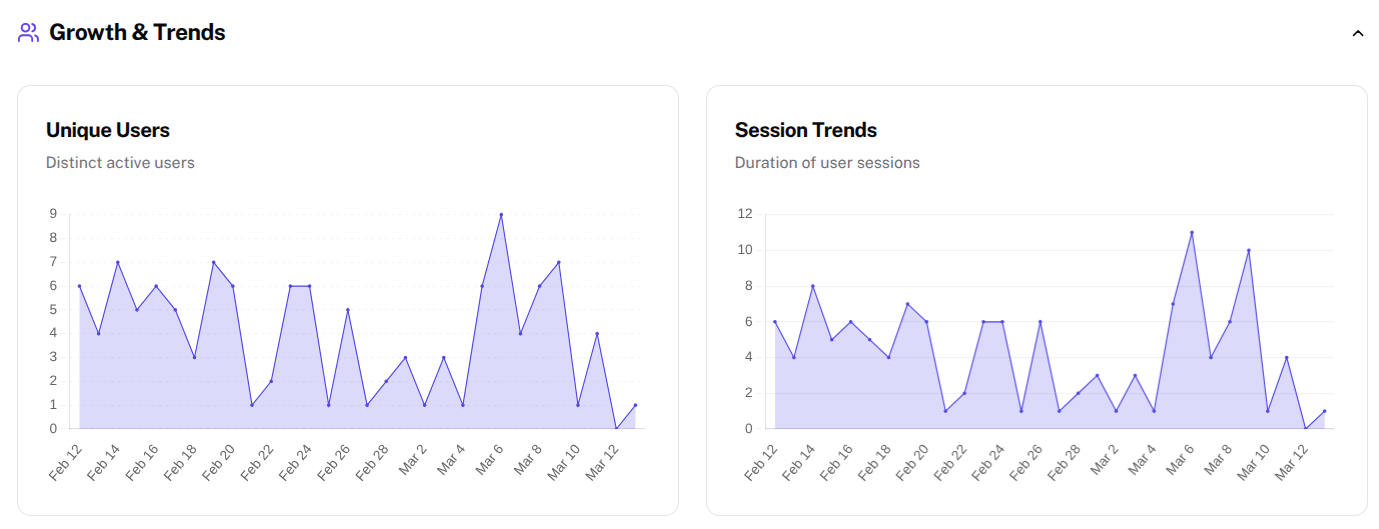
The Growth & Trends section highlights user activity trends.
It includes:
Unique Users
Shows the number of distinct users interacting with the 3D viewer.
This metric helps measure how many individual customers are exploring the product experience.
Session Trends
Tracks the duration and number of user sessions over time.
Longer sessions generally indicate deeper engagement with the product.
User Locations
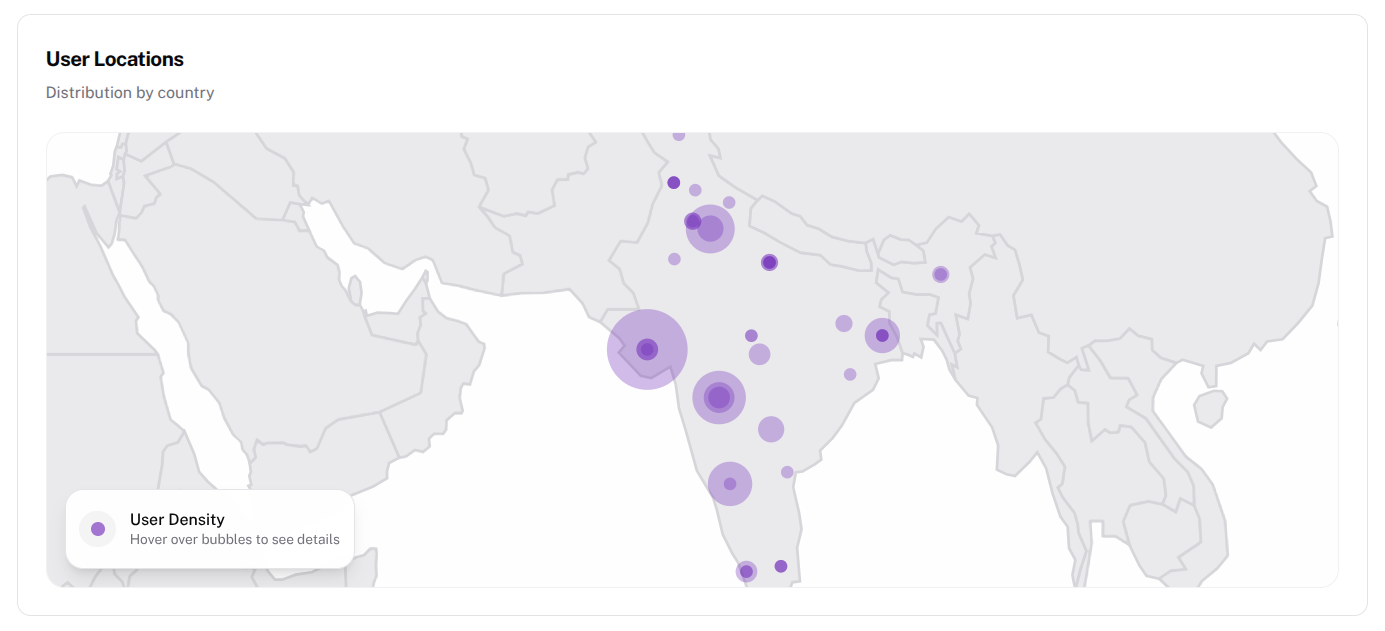
The User Locations map visualizes where users are accessing the 3D experience from.
Features include:
- Geographic distribution of users
- Interactive map showing user density
- Country-level engagement insights
This helps businesses understand where their product experience is most popular.
Add to Cart Analytics
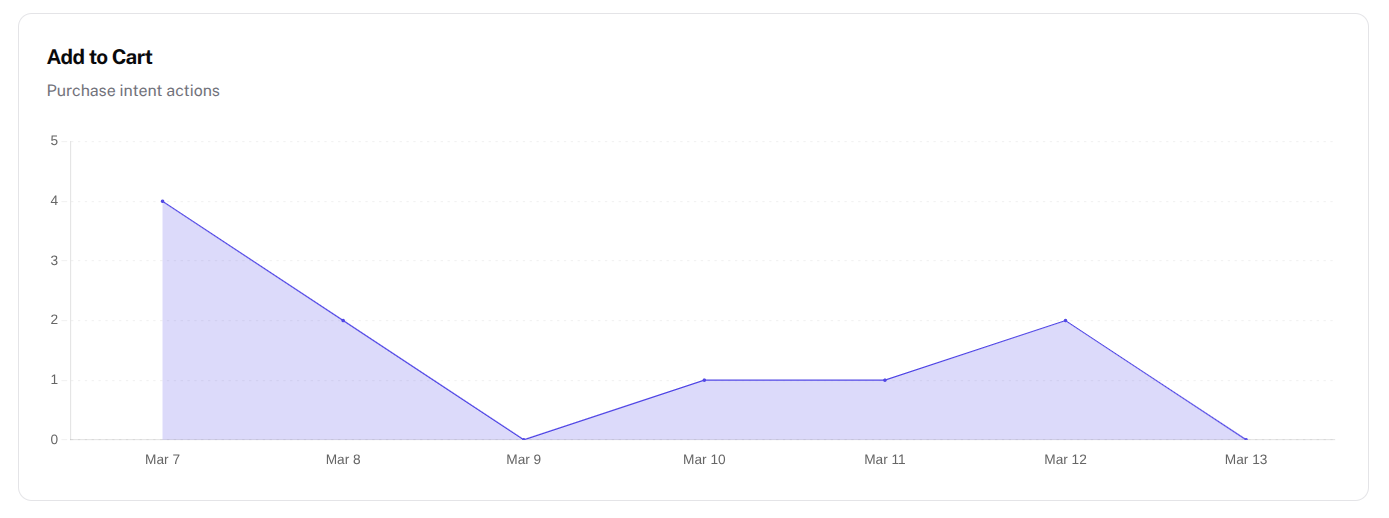
The Add to Cart analytics tracks purchase intent signals.
It records:
- how many users clicked Add to Cart
- when those actions occurred
- trends across time
This helps measure how interactive experiences influence purchasing decisions.
Engagement Analysis
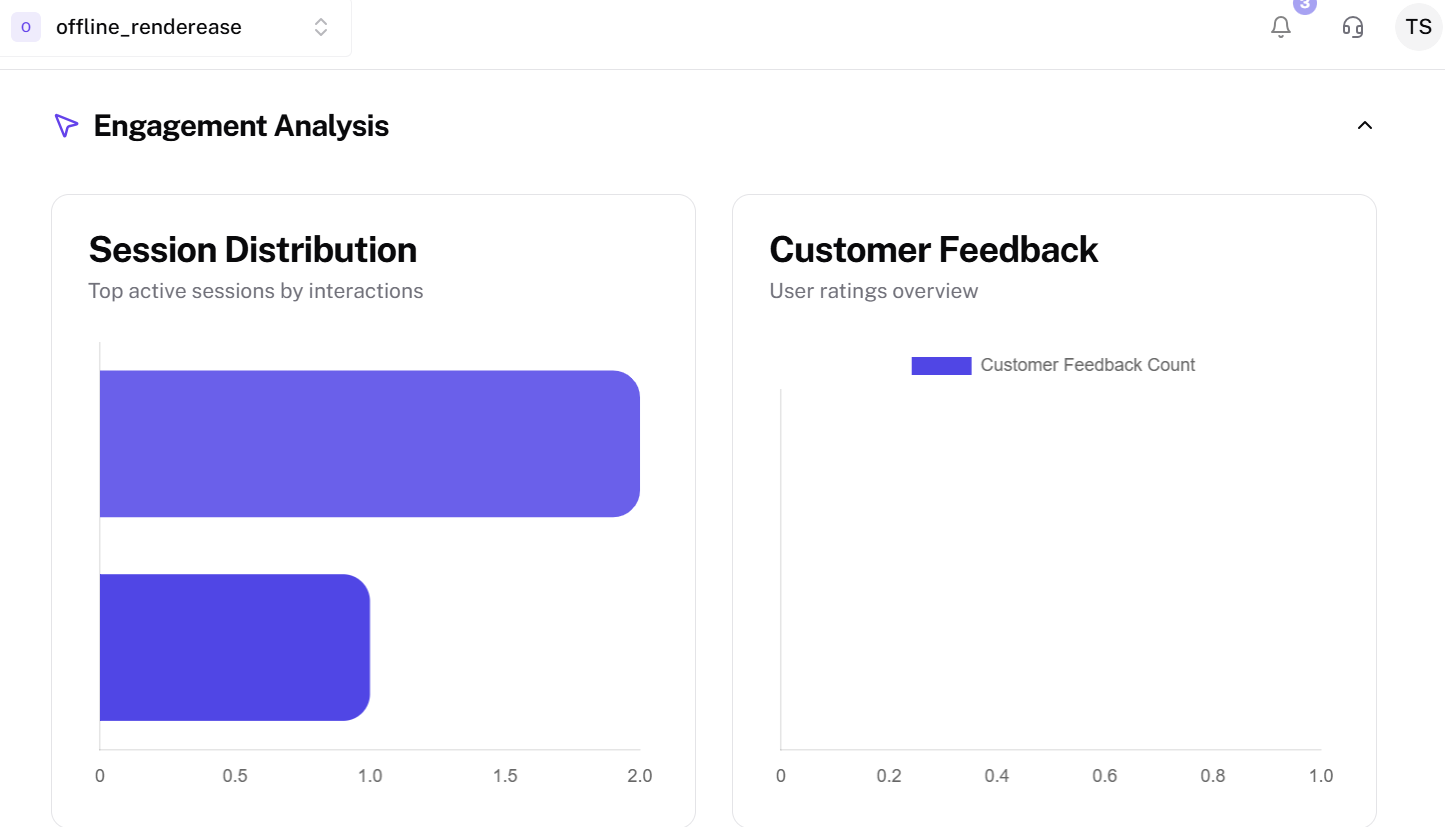
The Engagement Analysis section measures how users interact with the product experience.
It includes:
Session Distribution
Shows which sessions generated the most interactions.
Customer Feedback
Displays feedback collected from users interacting with the product.
These insights help understand which experiences resonate most with users.
Content & Devices
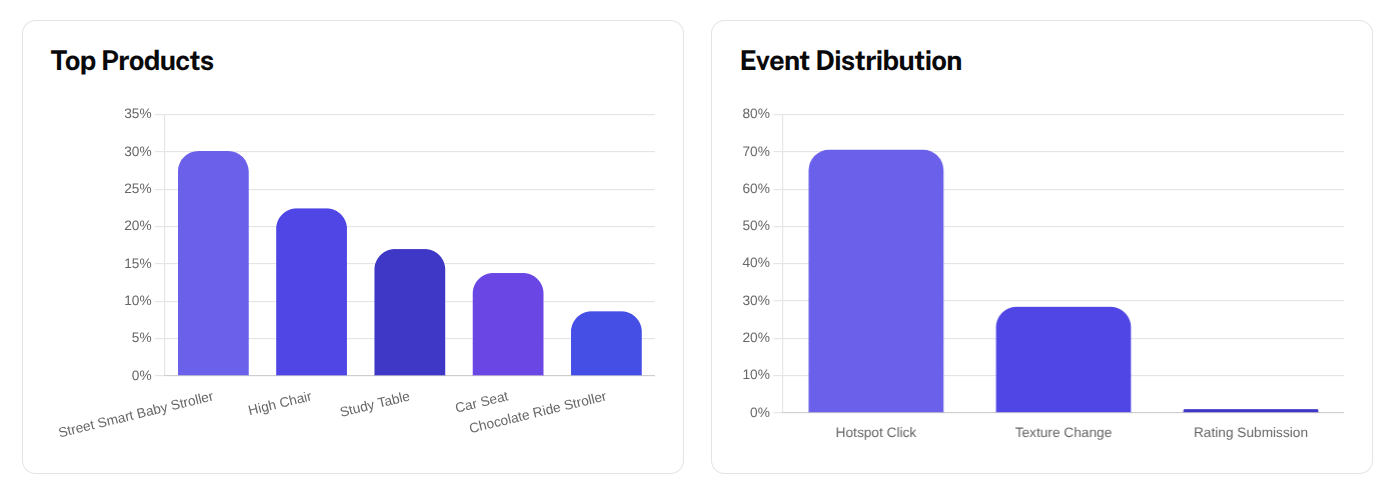
The Content & Devices section shows how users interact with products across different devices.
Metrics include:
Top Products
Identifies which products receive the most interactions.
Event Distribution
Shows how frequently different viewer events occur.
This helps businesses determine which products attract the most user attention.
View Types, Device Usage & Interaction Types
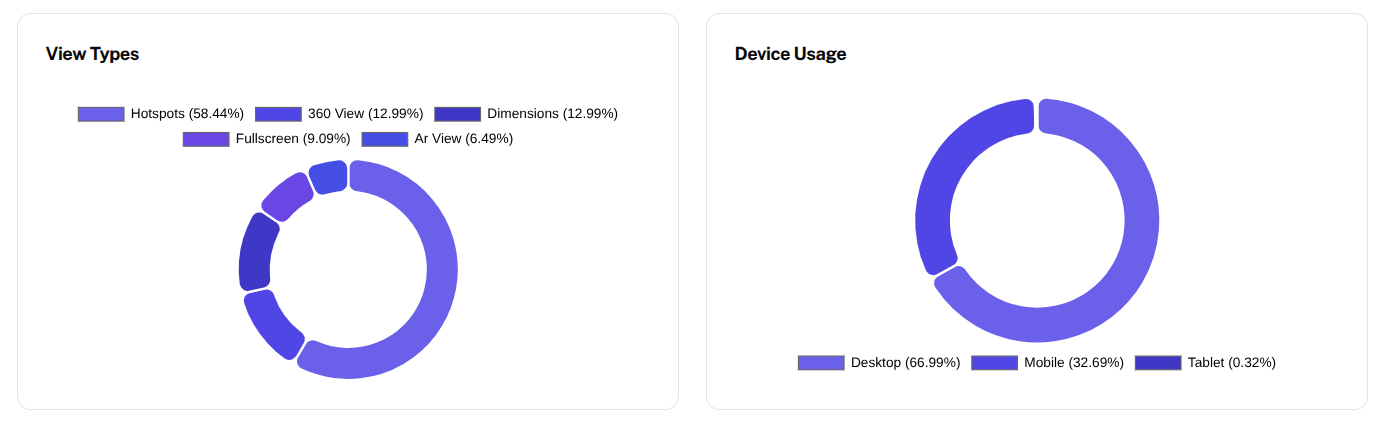
This section provides detailed breakdowns of viewer activity.
View Types
Shows how users interact with features such as dimensions, hotspots, and customization options.
Device Usage
Displays which devices users use to access the 3D experience.
Examples include:
- Desktop
- Mobile
- Tablet
Interaction Types
The Interaction Types section shows how users interact with the 3D viewer features.
Common interaction types include:
- Hotspot Click – When users click on product hotspots to view additional information.
- Texture Change – When users change the material, color, or finish of the product.
- Dimensions View – When users enable dimension overlays to inspect product measurements.
- Zoom Interaction – When users zoom in or out to inspect product details.
- AR View – When users launch the product in Augmented Reality.
Tracking these interactions helps understand which product features attract the most attention and how customers explore the product experience.
Filtering Analytics Data
At the top of the Analytics dashboard, users can adjust the data range and filters.
Available controls include:
- Date Range Selector – View analytics for a specific period
- Refresh Button – Update the analytics dashboard
These controls help analyze data based on specific timeframes and product interactions.
Summary
The Platform Analytics dashboard provides powerful insights into user behavior, product engagement, and interaction trends.
By monitoring these analytics, businesses can:
- understand how users interact with 3D products
- identify popular product configurations
- improve product presentation
- optimize conversion performance